Chrome Devtools Protocol exposed through a Remote Debugging Port
Workflow
Let’s say we compromise a web application and gain code execution, then we establish a remote connection via a Reverse Shell
Once we break into the machine, we start enumerating the entire system. During this process, we list running processes in the target and see that there is a chrome instance running in headless mode with a remote debugging port accesible
So first, we start checking if the given port is accesible locally. If so, we continue by sending an HTTP request to the /json endpoint to gather some information about the Chrome instance
The key field is webSocketDebuggerURL, because it exposes the WebSocket endpoint used by the Chrome Devtools Protocol to interact with that specific browser tab
So, we can carry out all the mentioned actions, such as retrieve sensitive stored cookies, by accessing this websocket using the CDP
To do this, we can use tools such as chrome://inspect, devtools clients or offensive tooling, such as WhiteChocolateMacademiaNut. All of them connect to the WebSocket listed on the /json endpoint and send CDP commands
Requirements
Chrome/Chromium running on the Target Machine
The Debug Option used during its startup
e.g. --remote-debugging-port=<PORT>
The Debug Port must be accesible
Abuse
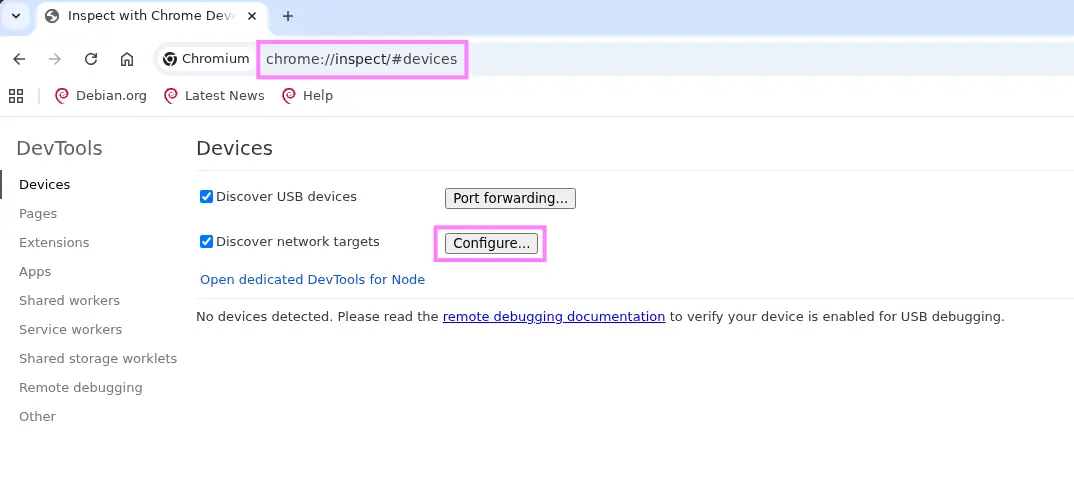
chrome://inspect
Simply open Chrome/Chromium and enter the Internal URL above
Then, we can add a new network target by selecting the Configure option
Zoom in
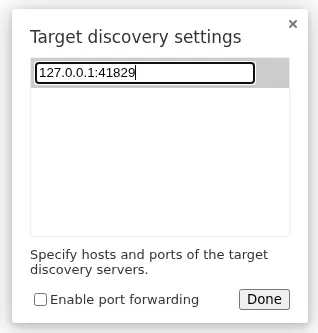
Next, enter the IP Address and TCP Port
Zoom in
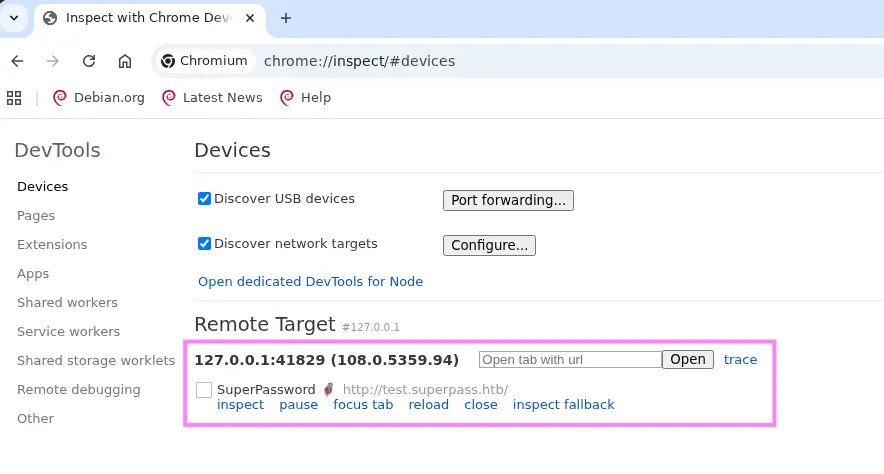
Once we save the options above, we will see an avaiable remote target
Zoom in
Once we inspect it, we will be able to access the given browser session and retrieve all the necessary information